Forest and Conservation Science Under Climate Change
Multiple methods can be used to assess complex issues relating to forest ecosystem responses & management under climate change:
|
Genetic Provenance Trials as Climate Change Laboratories
Provenance trials are reciprocal transplant experiments that involve collecting seeds from across a species range and planting them at field test sites (common gardens). Since test site conditions are relatively uniform, any differences in performance can be attributed to genetics. Historically, these trials have been used to assess timber quality and adaptation to climate. More recently, they are being used to study real-world responses to climate warming since transferring seeds from northern environments to warmer, southern planting sites can simulate a warmer climate. At the same time, transferring southern seeds to northern planting sites can assess the limits to acceptable seed transfer (assisted migration). Studying the responses of seed sources tested under different environmental conditions can therefore inform reforestation strategies and policies such as climate-based seed-transfer. |
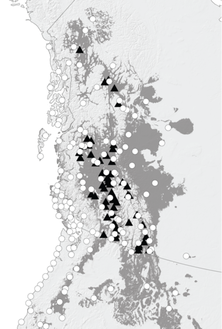
Provenance trial of lodgepole pine, with the species range shown in grey, circles are seed sources, and triangles are planting sites.
|
|
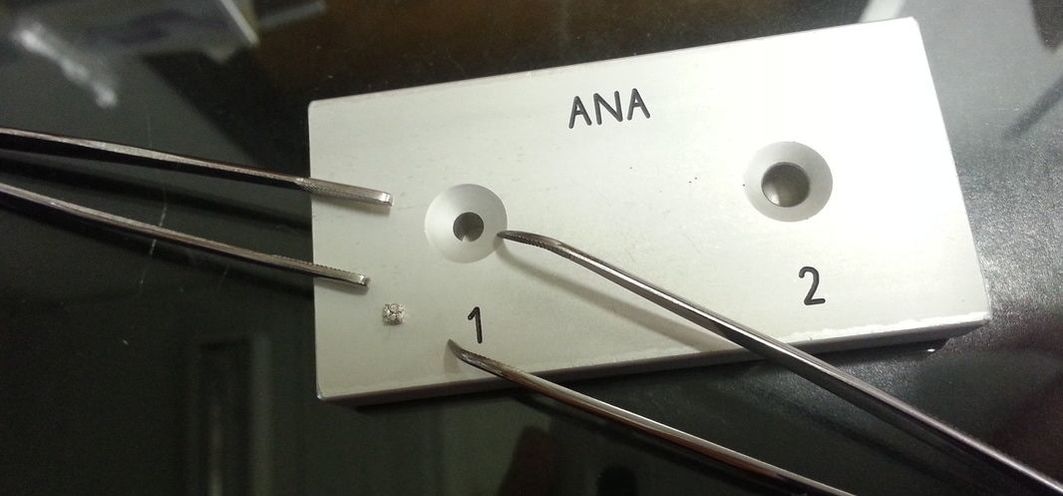
Tree Growth: Height and Diameter
Forest productivity is of interest economically and also for ecosystem health. Growth can sometimes be used to assess survival and fitness. Changes in growth patterns can also be used as an indication of tree stress, which decreases vigor and increases susceptibility to insect attack. Further, growth can also be used to estimate carbon absorption and storage. Growth and yield modeling relies on tree height as well as diameter at breast height (1.3 m) at a certain tree age. These are the most commonly-used and reported parameters. These can be used to calculate volume and, in turn, carbon. Diameter can also be used to calculate basal area, which is the surface area represented by the trees (at 1.3 m) across an area (e.g. hectare). Foresters use this parameter along with stem density and ecological conditions at the site to understand and effectively manage a forest. Also useful is the ability to reconstruct basal area increment using tree rings. Basal area increment is the total area of annual growth (i.e. the surface area of the new growth in any given year). Tree ring widths can be used to calculate basal area increment. Increment borers can be used to obtain tree cores, but, when possible, stem disks enablesa more true estimation of basal area increment because there are more radii from which to calculate tree ring widths. Annual height increments can also be estimated by measuring the distance between each set of branches since branches grow in clusters (whorls) that indicate the start of a new growing season. These can be estimated with a telescoping measuring pole while the tree is still standing. It is more accurate to use a measuring tape to measure total height and distance between each branch whorl after a tree has been felled. This is often not possible - we were fortunate in our research to inherit valuable planting sites that had experienced high mortality due to mountain pine beetle, and the ministry of forests granted us permission to cut these trees to salvage as much information from these expensive experiment as possible. |
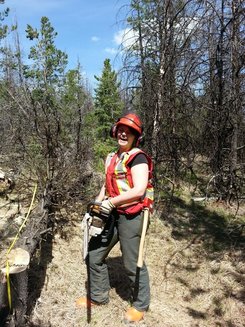
We were granted permission to cut dead pines (killed by the mountain pine beetle) in a valuable provenance trial to measure height, annual height increments and to take stem disks.
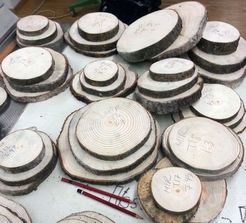
Stem disks are sanded and scanned, and tree-ring widths are measured to reconstruct annual diameter growth (basal area increment). Stem disks are also used for isotope and wood anatomy procedures.
|
|
Tree Rings and Stable Isotopes
An isotope of an element has a different number of neutrons relative to protons. For instance, Carbon-13 has 7 neutrons and 6 protons and is a stable isotope of carbon, occurring more rarely than Carbon-12. This minor difference is actually biologically significant because plants discriminate against the heavier isotope. However, under stress, plants have a lower ability to discriminate and take up a higher proportion of the heavier isotope during photosynthesis. The resulting sugars are stored in plant tissues, e.g. in tree rings. Using stable carbon and oxygen isotopes, we can infer the response of stomata, which are small holes on the leaves that act like the tap that helps control the water pipeline in the tree. When combining the understanding of such leaf-level processes with functional wood anatomy analyses (see below), we can understand a tree's general water use strategy. Further combining the annual resolution afforded by tree rings with genetic provenance trials allows us to assess how different populations have responded to drought in the past. This can indicate if their physiological strategy will remain effective under climate change - and for how long. |
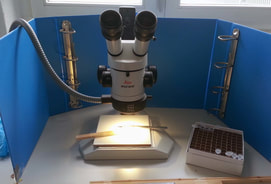
Individual tree rings are separated from wood sections under a stereomicroscope using a scalpel.
Finally, the homogenized sample is weighed with a precise scale and packed into tiny tin capsules prior to isotope ratio mass spectrometry.
|
|
Tree Rings and Functional Wood Anatomy
Trees are incredible organisms. Their internal structure of wood cells (xylem) fulfill several functions: storage of carbohydrates, mechanical support, and they enable the long distance water transportation from roots to leaves. The function as a hydraulic pipeline is relevant to drought tolerance. Trees with more narrow conduits (tracheids) can tolerate more negative water potentials as water is pulled under tension from the roots to the evaporating leaf surfaces (water molecules are pulled upward to replace the evaporated water thanks to hydrogen bonds). While more narrow conduits confer drought tolerance, these traits are also associated with trees of shorter stature: there is a trade-off between growth and drought tolerance. Trees are also capable of responding to drought events by modifying their internal structure. How quickly and effectively they can respond can influence their tolerance to drought as well. Wood anatomical features have also been linked to cold tolerance. Tracheids that have thicker cell walls and smaller centers (lumen) are less vulnerable to cold damage and freeze-thaw induced embolisms that can threaten the hydraulic pipeline in the same way as severe drought. Finally, frost imprints in tree rings indicate reactions to particularly severe cold temperatures. While these tend to occur more frequently in small seedlings, they can nevertheless be used as a dendrochronological tool (frost event reconstructions). Combined with provenance trials, they can indicate intra-specific genetic differences in cold tolerance, with implications for assisted migration. |
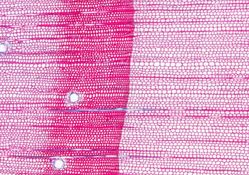
Transverse micro section of wood with a tree ring boundary (pith to the left), revealing a cross-sectional view of tracheids - the cells that conduct water from roots to leaves. Tracheids in the earlywood are larger and have thinner cell walls than the darker-coloured latewood.
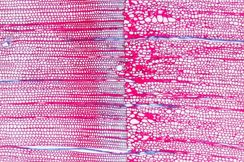
A micro section showing frost damage. Due to a double-staining procedure with Astrablue (stains cellulose blue) and Safranin (stains lignin red), most cells become pink. The area of blue cells at the end of the latewood (a 'blue ring') therefore indicates a lack of lignin. It is followed by a severe frost ring in next year's earlywood.
|
|
Bioclimatic Envelope Models (aka Species Distribution Models)
Plants and trees are adapted to the environments in which they grow. A large component is adaptation to climate. Bioclimatic envelope models link the presence/absence of a species (or population) with the climate where it occurs -it's 'climate envelope'. It is widely recognized that these models are imperfect because they are trained only on the 'realized niche' (where it actually occurs) and not the 'theoretical niche' (where it could occur if other factors like competition and soils). They are nevertheless a useful tool to understand where the climate habitat to which species (or populations) are adapted are shifting to under climate change. Different methods exist, but I am most familiar with the Random Forest procedure in the R statistical programming environment. Random Forest "grows" hundreds of classification trees that split the data into groups by the variables that explain the most variance. The importance value of each variable can also be extracted from the model, which helps the user understand which predictor variables are relatively more important. Bioclimatic Envelope Models should undergo a validation procedure after development. Often this involves leaving out part of the data (~1/3) while training the model, which can then be used for cross-validation. Validation with external data is better, and growth data from provenance trials provide a suitable means for testing population-level models. Finally, downscaled climate data from future warming scenarios can be inputted into the model to predict where the climatic envelope will occur under different time spans and projections (with increasing uncertainty toward the end of the century). |
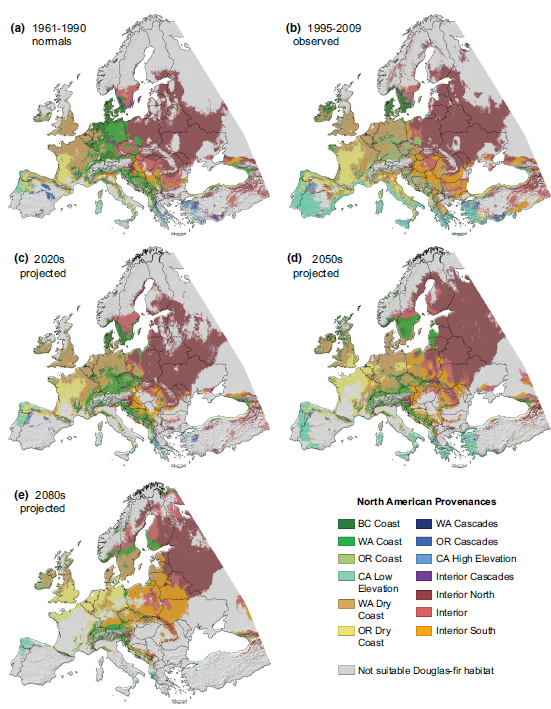
Species distribution model for Douglas fir in Europe. Each colour represents the optimal climate space for different populations (green = coastal; blue = high elevation; oranges = interior). These climate spaces have already shifted northward, a trend that is projected to continue.
|
|
Ecological Monitoring: Coastal and Endangered Garry Oak Ecosystems
The Garry Oak Ecosystem of coastal British Columbia has high value for its cultural heritage and floral diveristy. However, it is also one of the most endangered ecosystems in Canada. Challenges include exotic species invasion, fire suppression and expansion of human settlements. While there are many methods to study these effects, my work relied mainly on quadrats to measure native and introduced plant species cover. The most pristine examples of the Garry Oak Ecosystems occur on smaller islands, which are also linked to nearshore ecosystems. I have also been involved in monitoring projects of kelp beds and used the quadrat method to monitor the health of eelgrass beds. Kelp and eelgrass are like the forests of the sea, as they provide vertical structure and habitat for many marine species. |
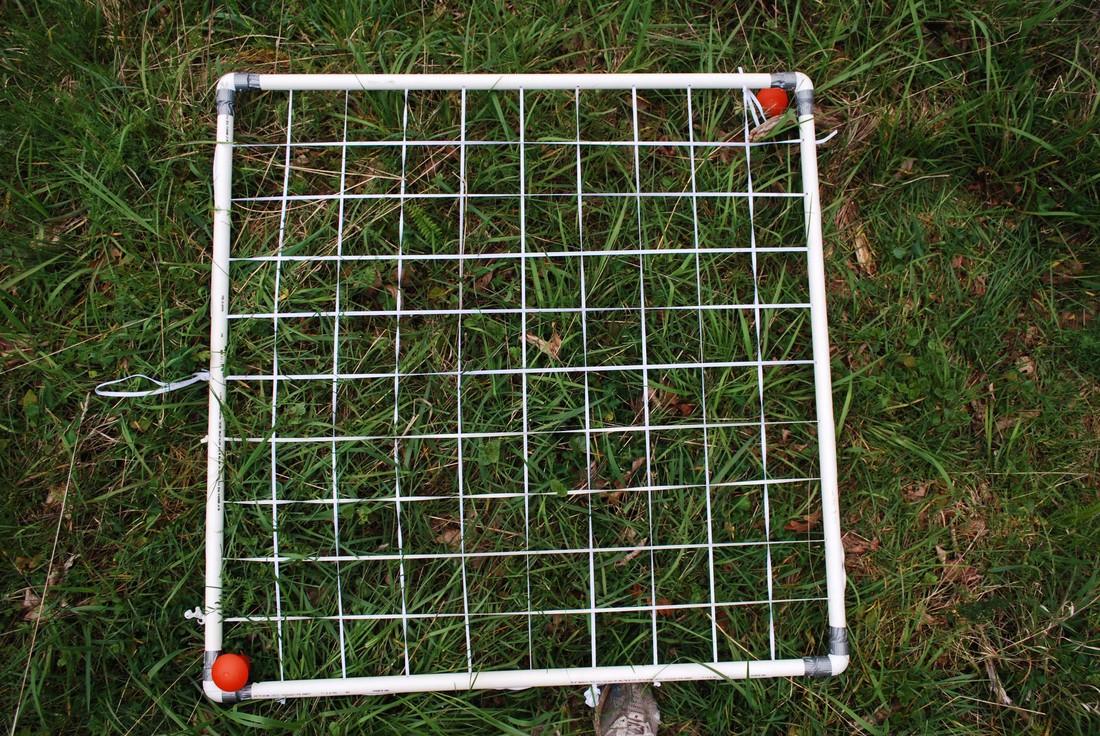
Plant species cover can be estimated using a 1m X 1m quadrat (each internal square is 1% of the area).
|
Forests | Climate Change | Quantitative Genetics | Adaptation | Tree-rings | Drought | Frost | Statistical Modeling | Ecosystems